Work
Liebherr
Visualization of complex crane data in the Liebherr App
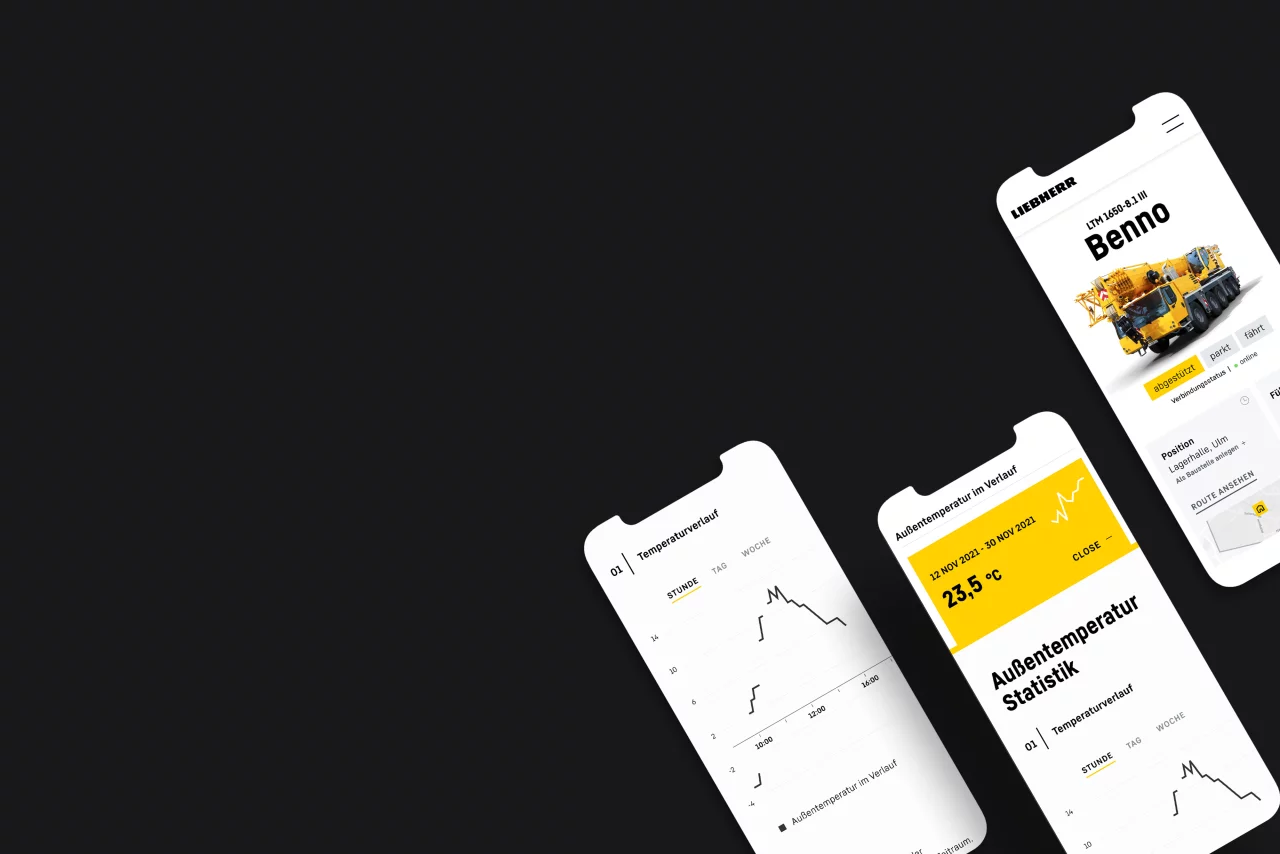
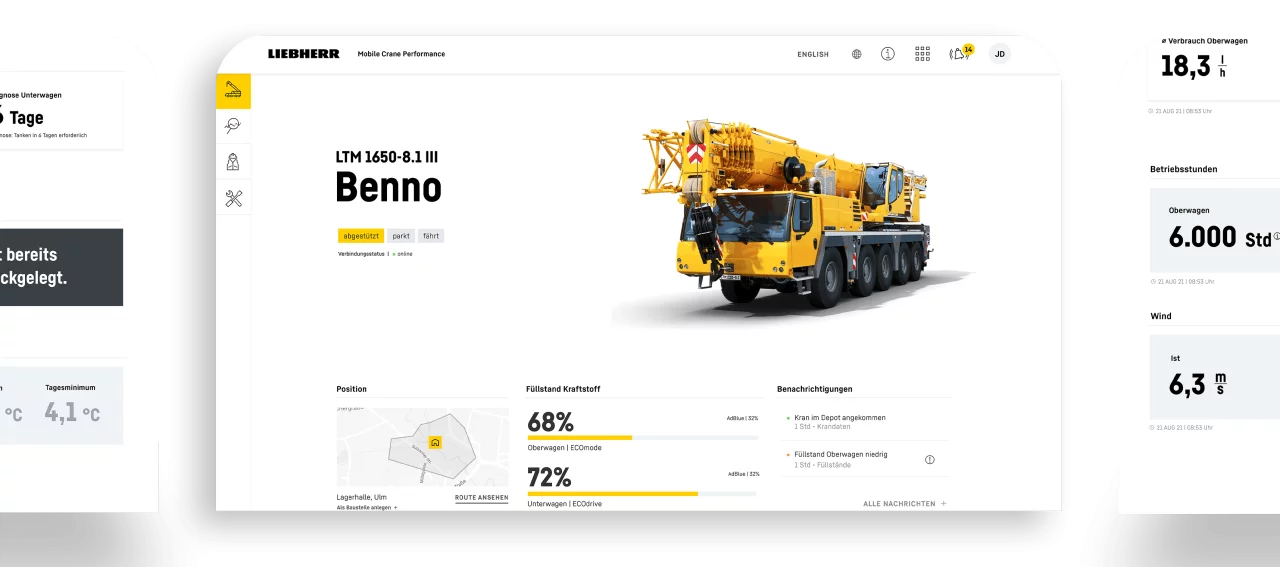
For our customer Liebherr, we have developed a telemetry app for the automated visualization of relevant crane data. This way, data can be retrieved easily, quickly and clearly as well as monitored in intuitive diagrams. This allows crane owners to quickly find out everything about their own crane: "Where is my crane?", "Is the tank still sufficiently full?" or "How much load is it currently carrying?". Complex data becomes easy to understand with the modern and intuitive User Interface. This is how we created the future of visualization and monitoring of their crane data in cooperation with our customer Liebherr.
What we did
Consulting/Conception
UX design
Development (FE)
Quality assurance
DevOps/Operations
Technical Platforms & Tools
Angular
Tailwind
Visualize and monitor complex data in real time? That is possible! With telemetry app for our customer Liebherr.

Challenge
Solution
Challenge
Liebherr
Prepare complex data sets in a structured manner
Measure, process and visualize complex data in real time: This is the basis for successful monitoring using data. Different data formats must be processed, correct data filtered and checked for the appropriate quality. The intuitive display of large amounts of data is another prerequisite for analyzing them quickly and easily.
Solution
Lemonize
Centralized visualization of complex data
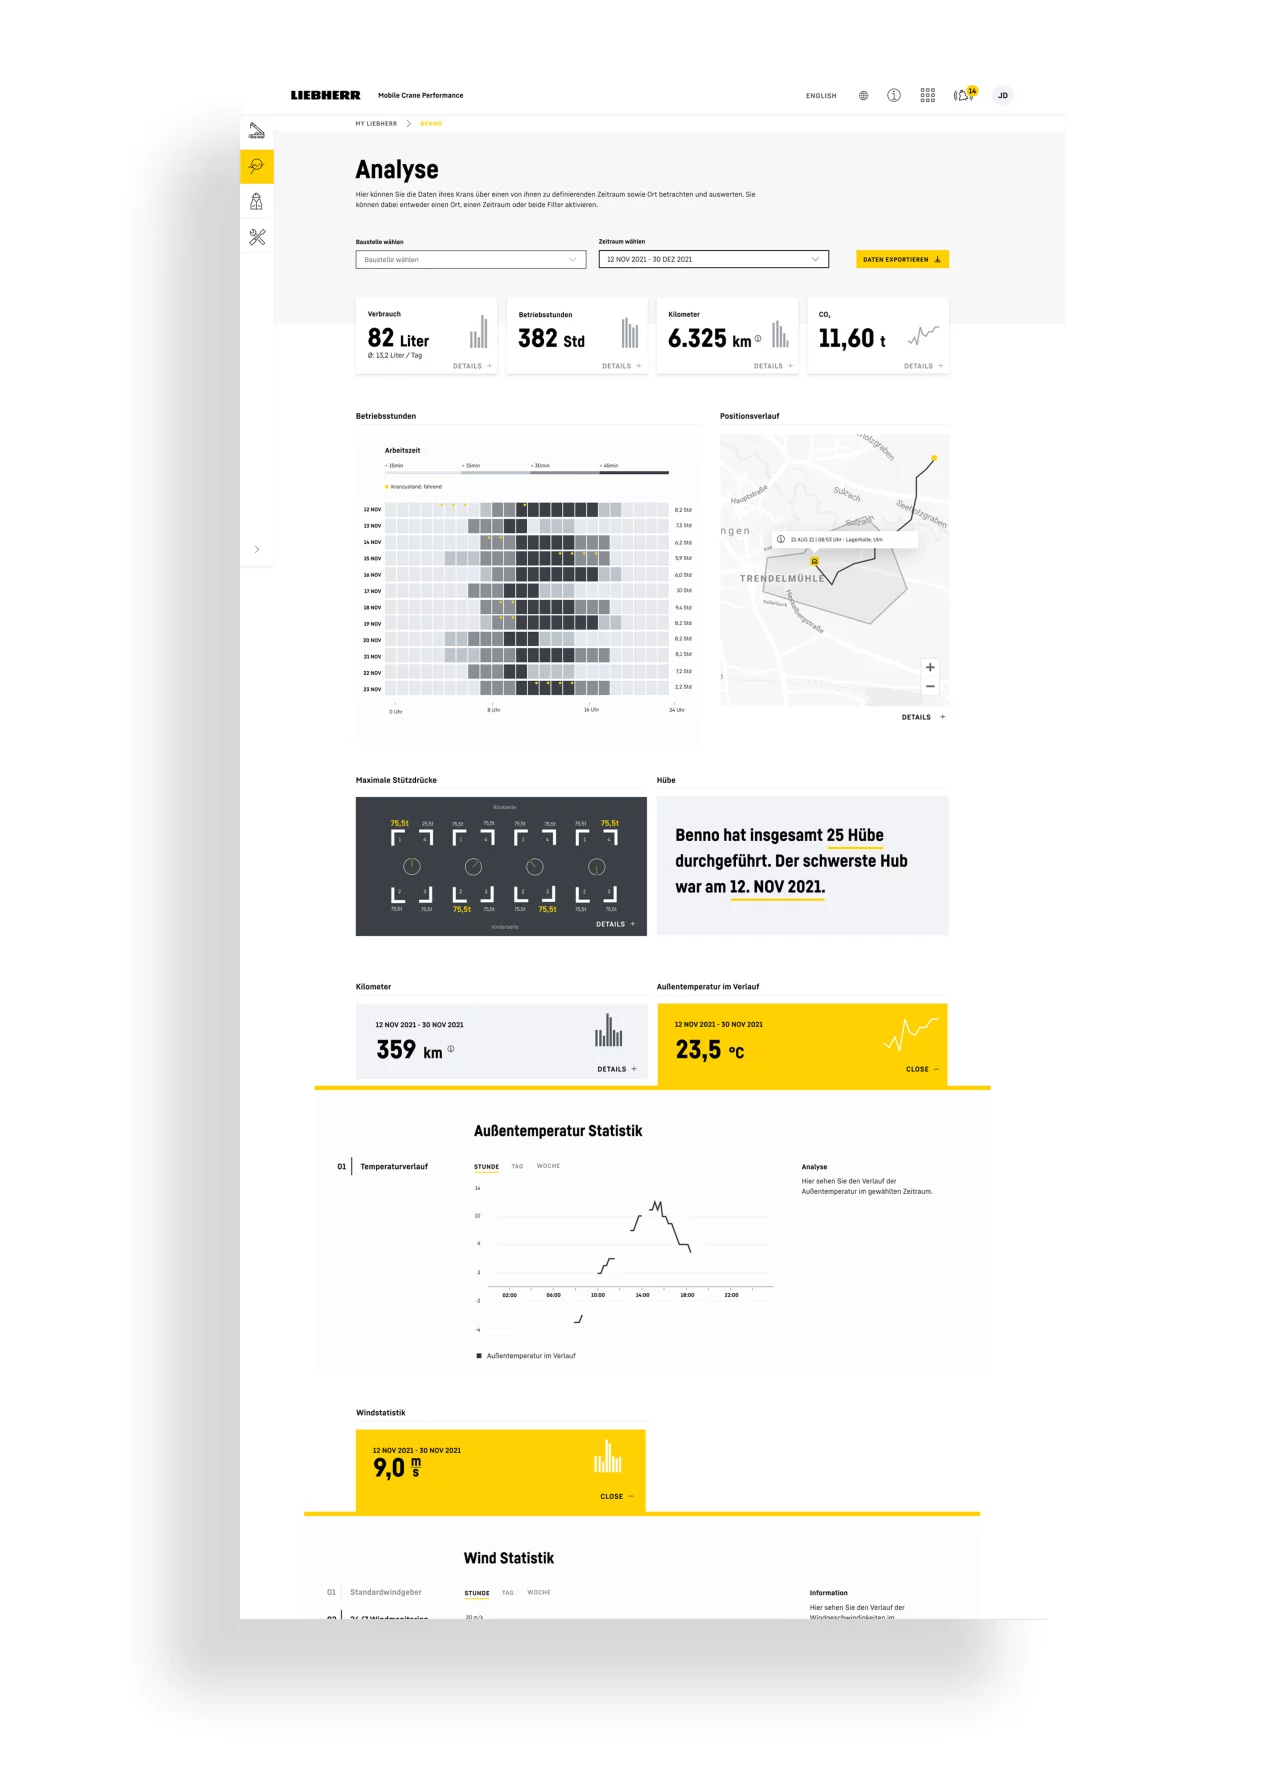
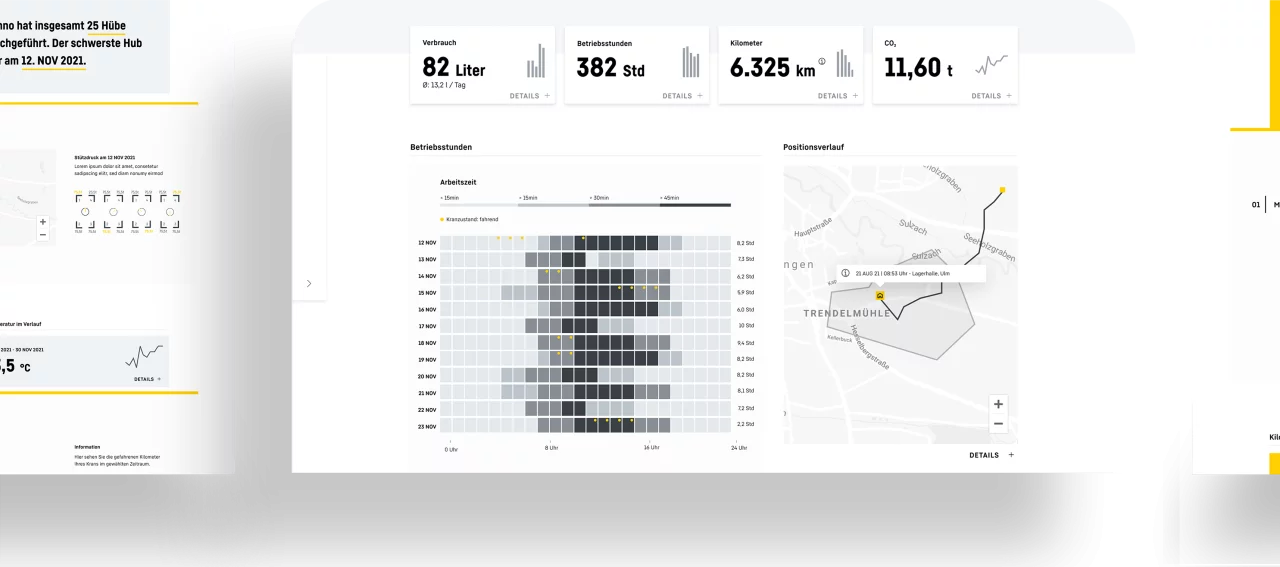
Our telemetry app enables the customer to retrieve relevant information and data in real time in a centralized manner in the form of different diagrams. The timely identification of potential requirements helps to maximize efficiency in planning in a targeted manner. For our customer Liebherr, this means the timely collection of and response to data, such as when a crane needs to be serviced or inspected. The integration of the metric and imperial system of units of measurement also enables the evaluation of a wide range of data formats.
Challenge
Liebherr
Reporting automation
Quickly accessible reports are a must in today's world in order to be able to react to upcoming challenges or changes in a timely and targeted manner. Based on relevant data, they offer the possibility for detailed analyses. Is there a problem with my machine? Do I need to react to something? Questions that can be clarified with reporting.
Solution
Lemonize
All relevant data at a glance with the telemetry app
With the telemetry app, the customer can not only check and analyze all relevant data at a glance. He also has the option of having all data automatically output in the form of a PDF. Reports can be generated either for a targeted time period or for a specific, geographic area - such as a single construction site.


Our telemetry app for Liebherr enables the user-friendly and intuitive visualization of different data formats in clear diagrams.
In the project, Lemonize integrates the frontend into the Liebherr backend system. This means strong collaboration and project management. In the implementation we use Tailwind, a utility-first CSS framework. In the implementation we use Tailwind, a utility-first CSS framework.
Project duration
1
year
Internationality
2
languages
Visualization
2+
diagram variants
Skills
Lemonize know-how